-
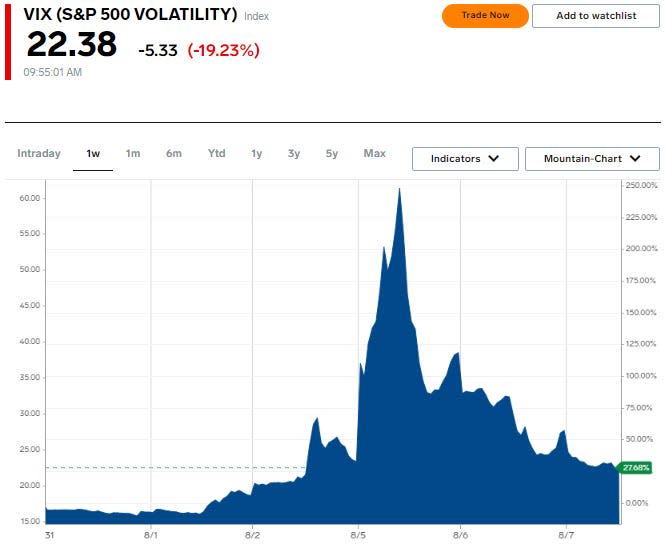
The fear indicator on Wall Street has pulled back after a historic rise earlier this week.
-
The VIX hit its third-highest level on Monday, amid a violent unwinding of the yen carry trade.
-
According to Fundstrat’s Tom Lee, the extent to which the VIX has fallen since then is a sign that the worst of the panic is over.
The historic rise and subsequent fall of Wall Street’s fear indicator suggests the worst of the stock market’s “growth fear” is over.
That’s according to Fundstrat’s Tom Lee, who said in a note Wednesday that the CBOE Volatility Index, better known as the VIX, is behaving as if the stock market has bottomed.
The VIX made history on Monday when it rose a record 172% intraday to 65.73, the third-highest level on record. The gains came amid a violent unwinding of the yen carry trade that has dragged down risky assets across the globe.
The only times the VIX reached a higher level were during the Great Financial Crisis in October 2008, when it peaked at 89.53, and during the COVID-19 pandemic in March 2020, when it peaked at 85.47.
But since hitting its third-highest level on Monday, the VIX has fallen sharply, from 65.73 to 27.71 on Tuesday, representing a peak-to-trough drop of 58%. Still, it remains significantly above where it was trading before the market sell-off.
“The VIX drop from 66 to 27 is a positive sign and a sign that ‘growth fear’ is present and the worst is likely over,” Lee said, adding that the normalizing VIX confirms that the stock market decline over the past week is not a systemic crisis.


The VIX closed down 28.2%, the second-sharpest daily drop ever, surpassed only by the 29.6% drop on May 10, 2010. That was the trading day after the Dow Jones Industrial Average had fallen about 9% in a matter of minutes in a sudden crash.
Ryan Detrick, chief market strategist at Carson Group, told Business Insider on Wednesday that when the VIX experiences such rapid declines, the stock market typically sees significant gains.
“The VIX closed down more than 10 points yesterday, which is very rare. The last time this happened was after the Flash Crash in May ’10, the U.S. debt reduction in August ’11, and March 2020. All three of those times were pretty bullish times for investors, and a year later the S&P 500 was higher each time, up an average of 37%,” Detrick said.
Fundstrat’s new note on Wednesday referenced commentary from last Friday suggesting that stocks could bottom out this week. At that time, the VIX was up 65% over the course of three days. Note that it was up another 65% on Monday as the S&P 500 had its worst day in two years.
The firm’s findings showed that since its inception in 1990, the VIX has experienced three-day gains of more than 65% and closed above the 25% level nine times.
In nearly half of these cases, stocks bottomed within days, and the S&P 500 returned a median 7% return over the next three months, for a 100% gain.
“When the VIX goes up that fast, half the time you’re at the end of a decline and you’re bottoming out within two days. So I think the rally that started today falls within those parameters,” Lee said in a video update to clients on Tuesday.
Since the VIX peaked on Monday, the S&P 500 has risen 4%, while the Nasdaq 100 has gained about 5%.
Looking ahead, lower interest rates have long been seen as a positive catalyst for stocks. Investors currently expect the Fed to cut rates by 100 basis points between now and the end of the year, according to the CME FedWatch Tool.
“There will be a real decline in the cost of money,” Lee said, which should be “hugely beneficial” for consumers taking out mortgages, auto loans and other types of loans such as credit cards and business loans.
“In short, the markets are definitely showing strong signs of getting their footing. And we see this panic ultimately as a growth fear as well,” Lee said.
Read the original article on Business Insider
